Power
99 kW
(134 HP)
0-100 km/h
8.8 s
Top Speed
162 km/h
Battery Options
Similar Electric Vehicles
View All Crossovers →
Fiat 600e
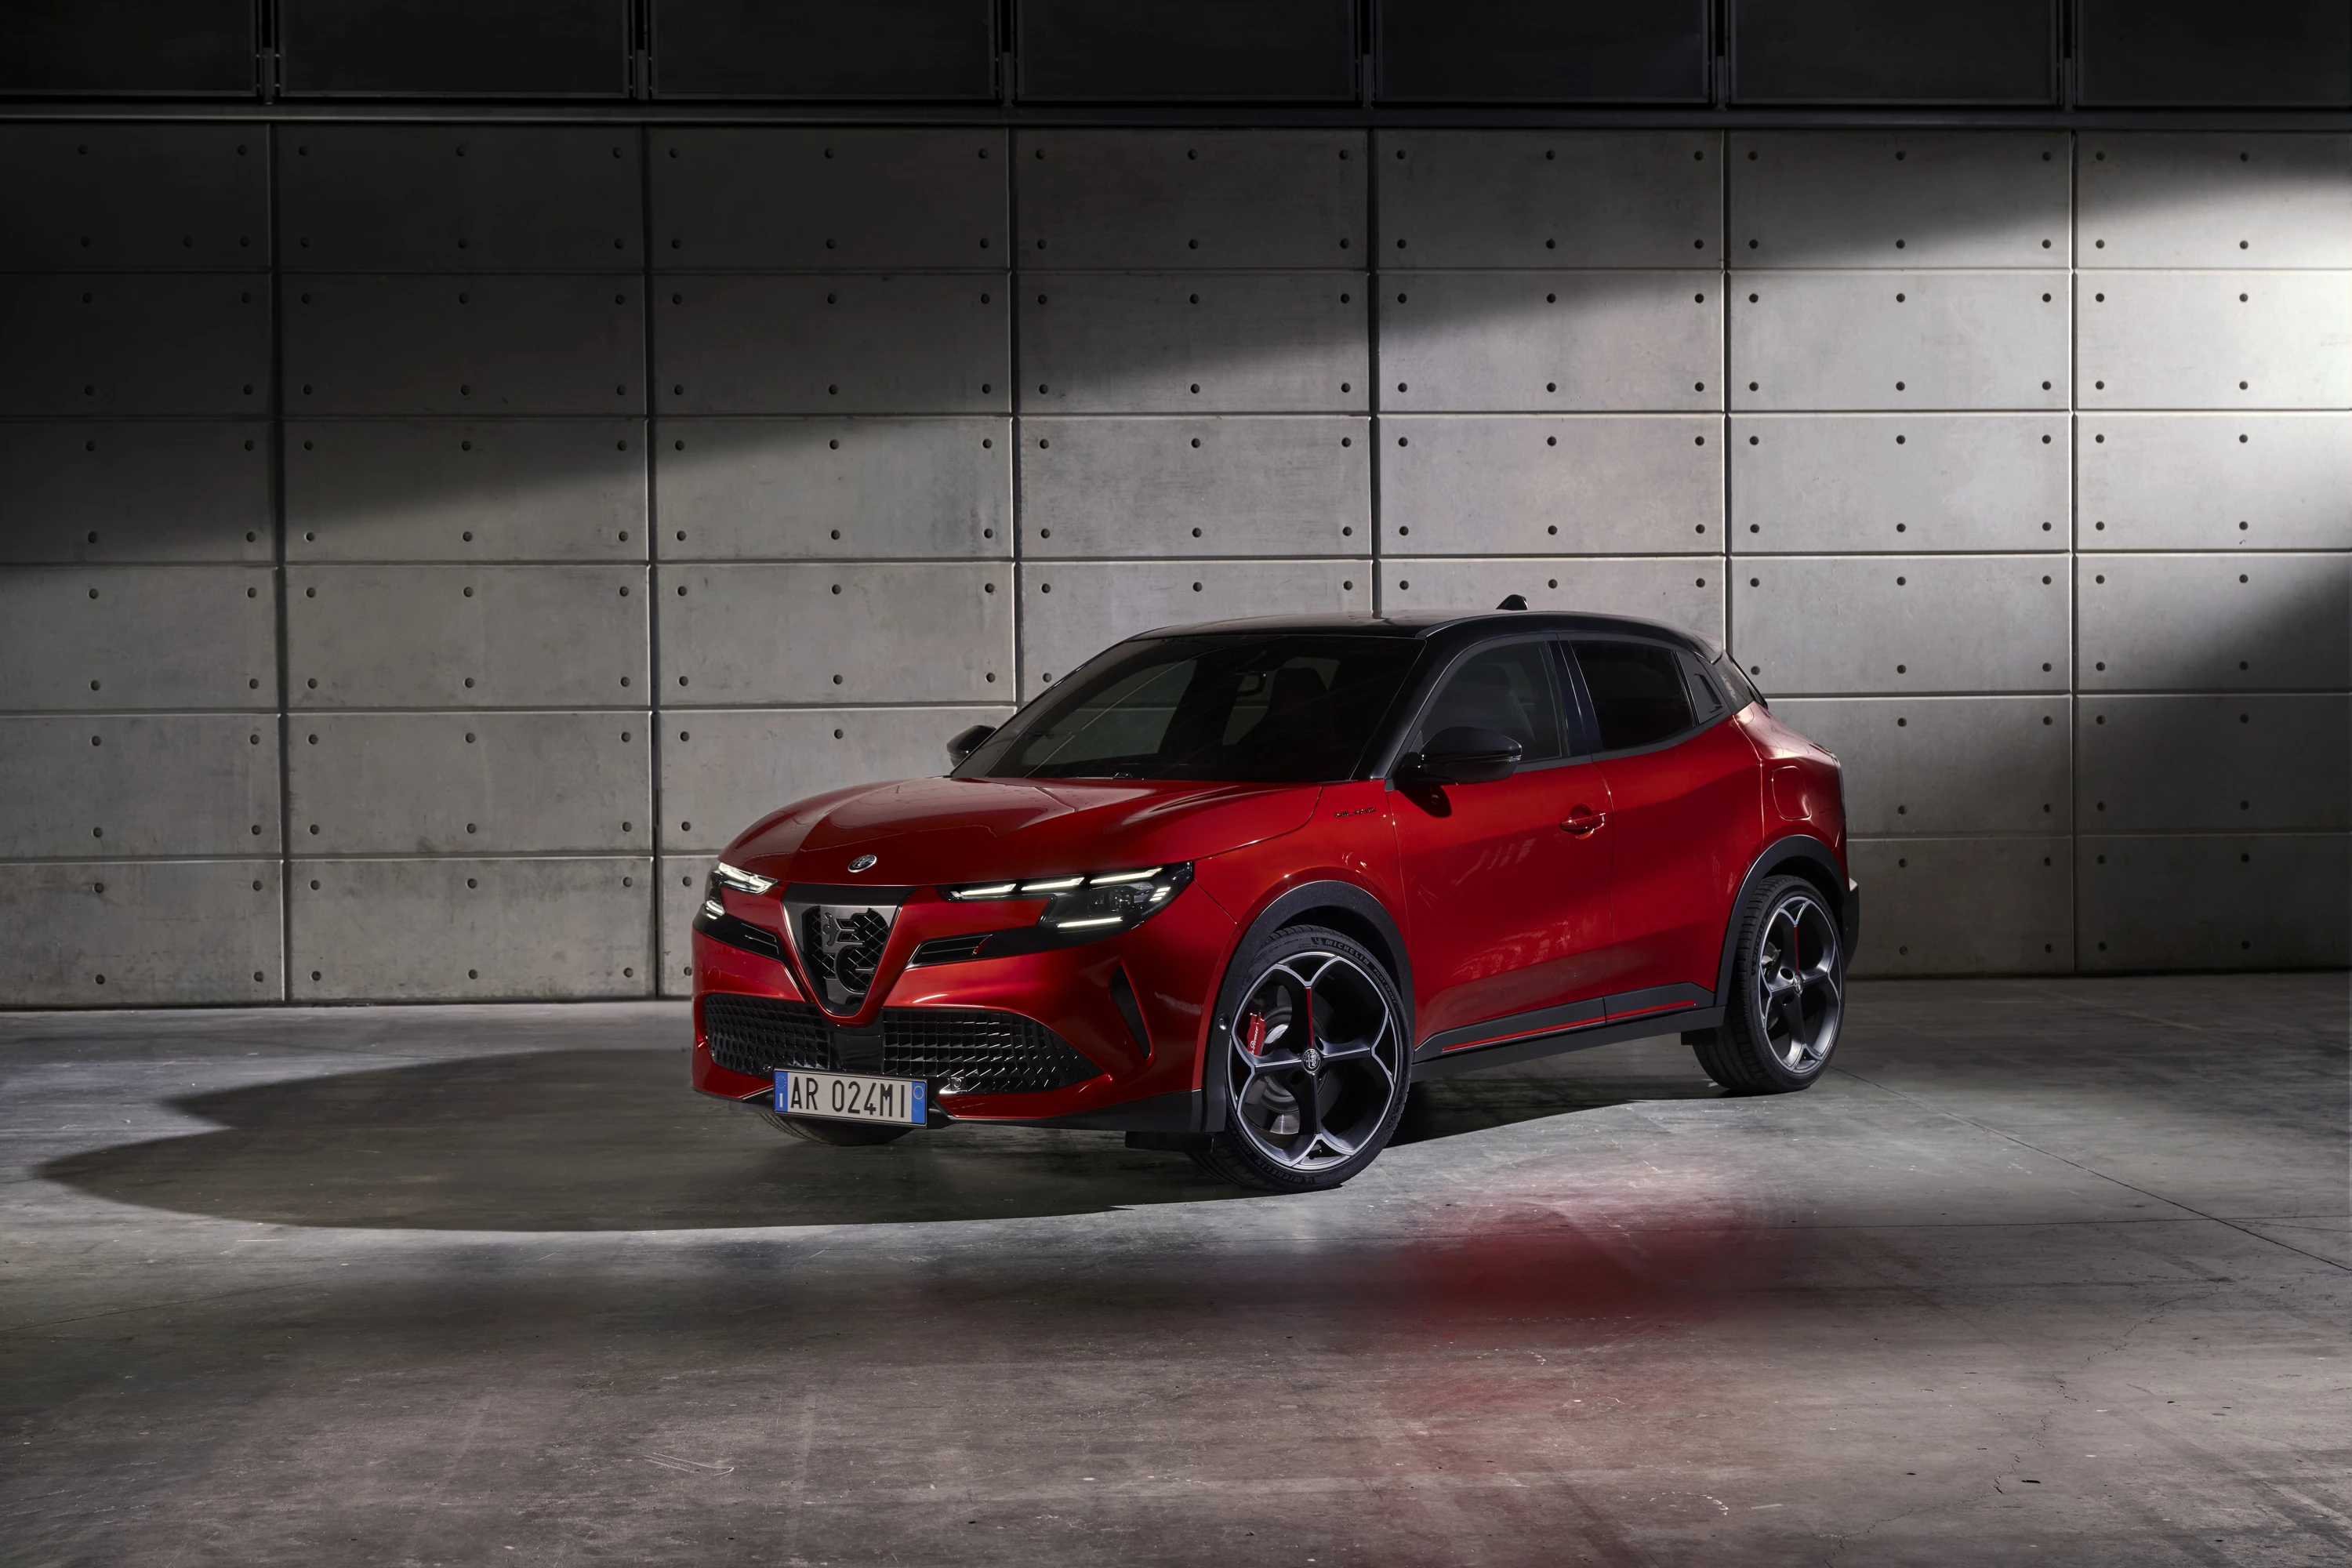
Alfa Romeo Junior
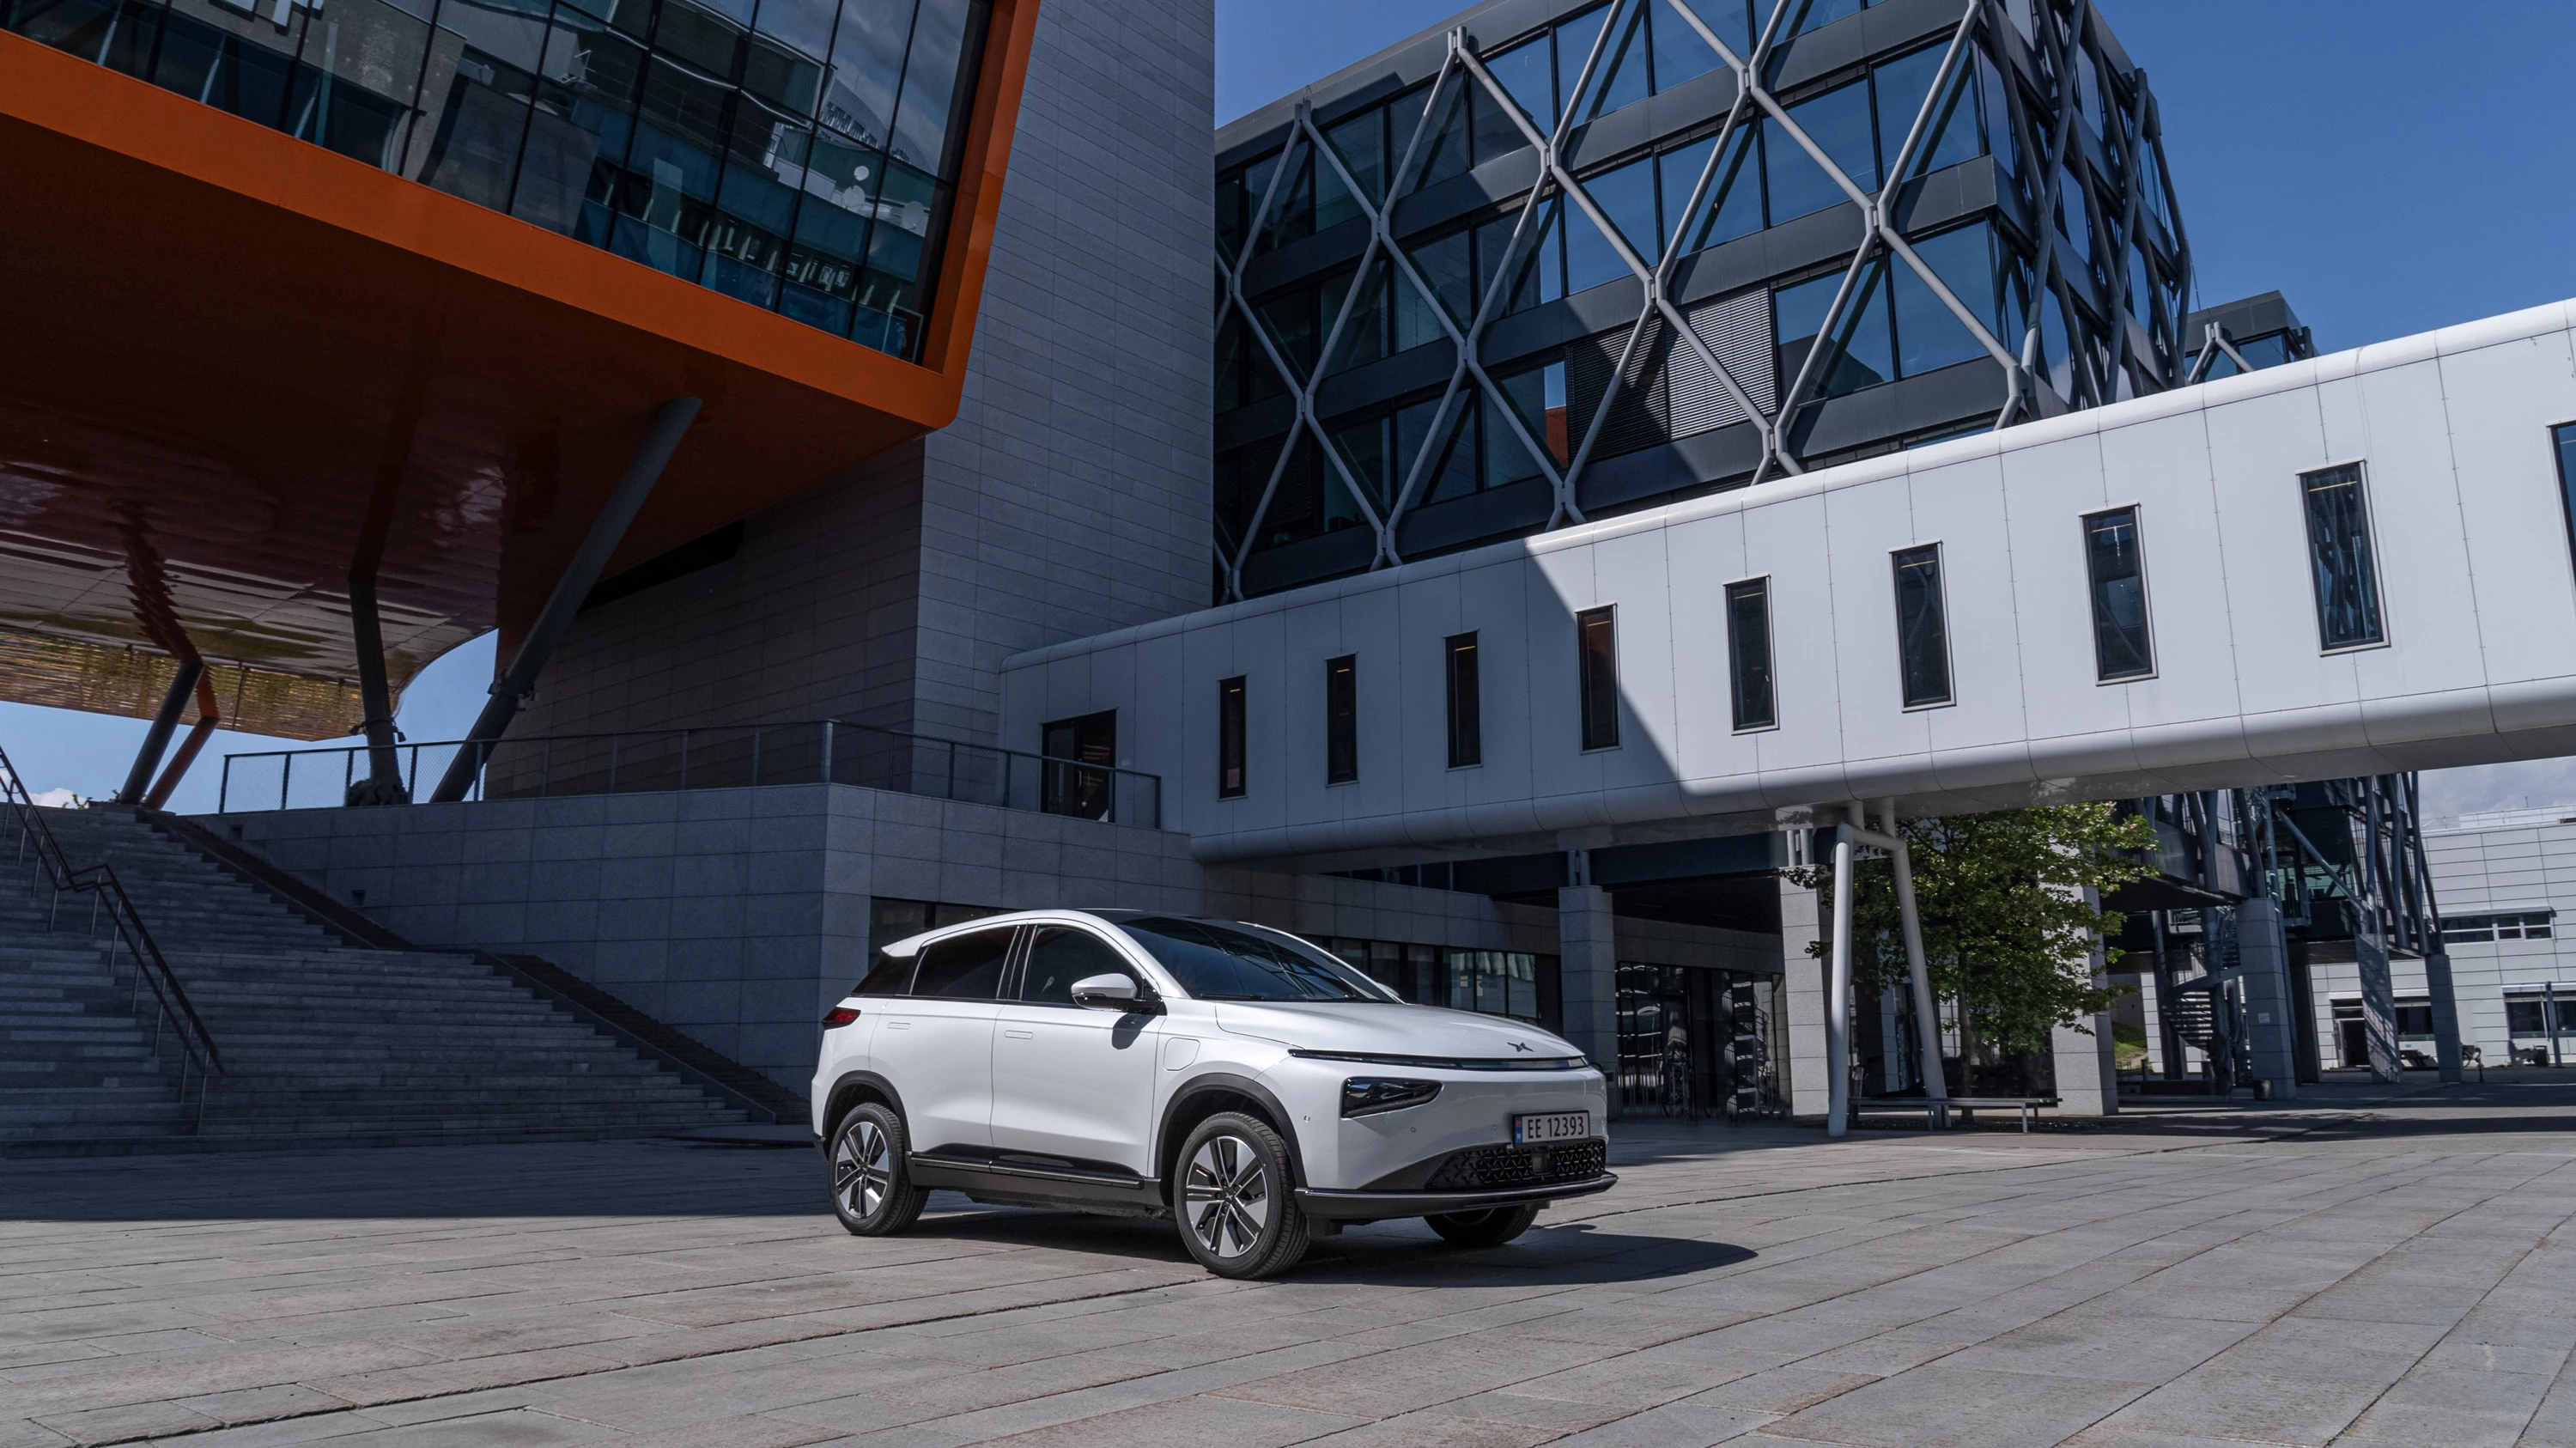
XPENG G3i
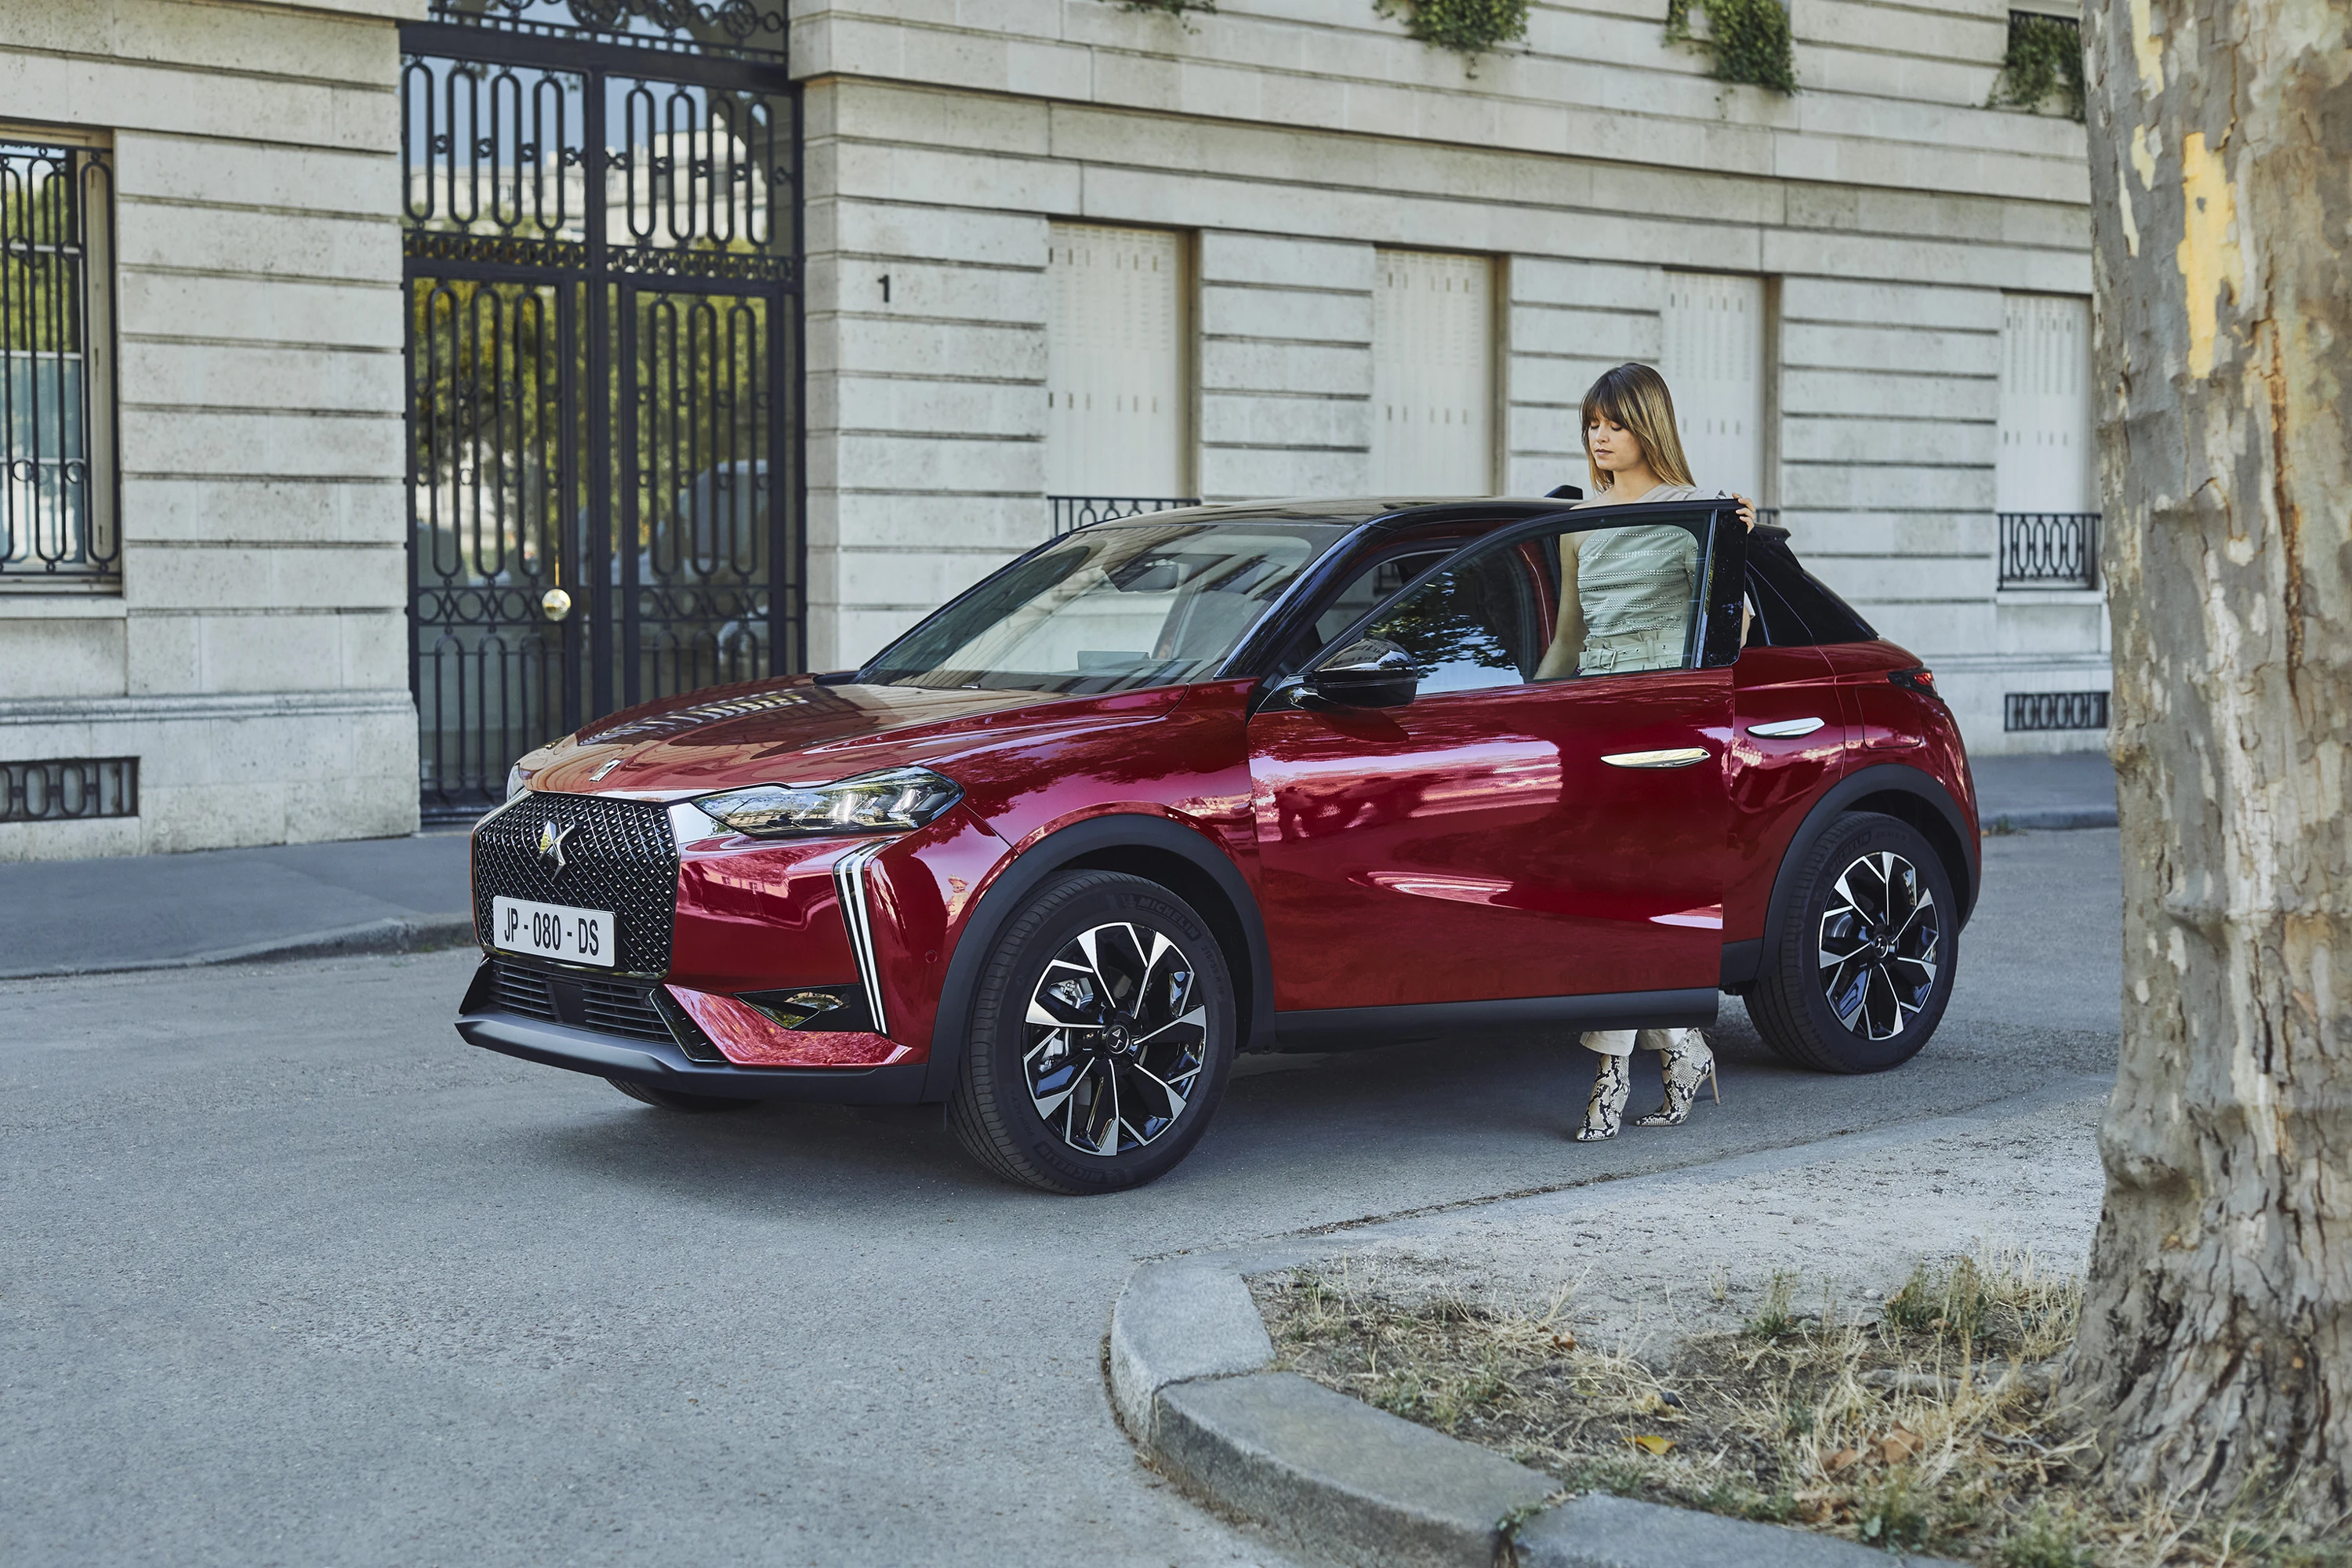
DS 3 E-Tense
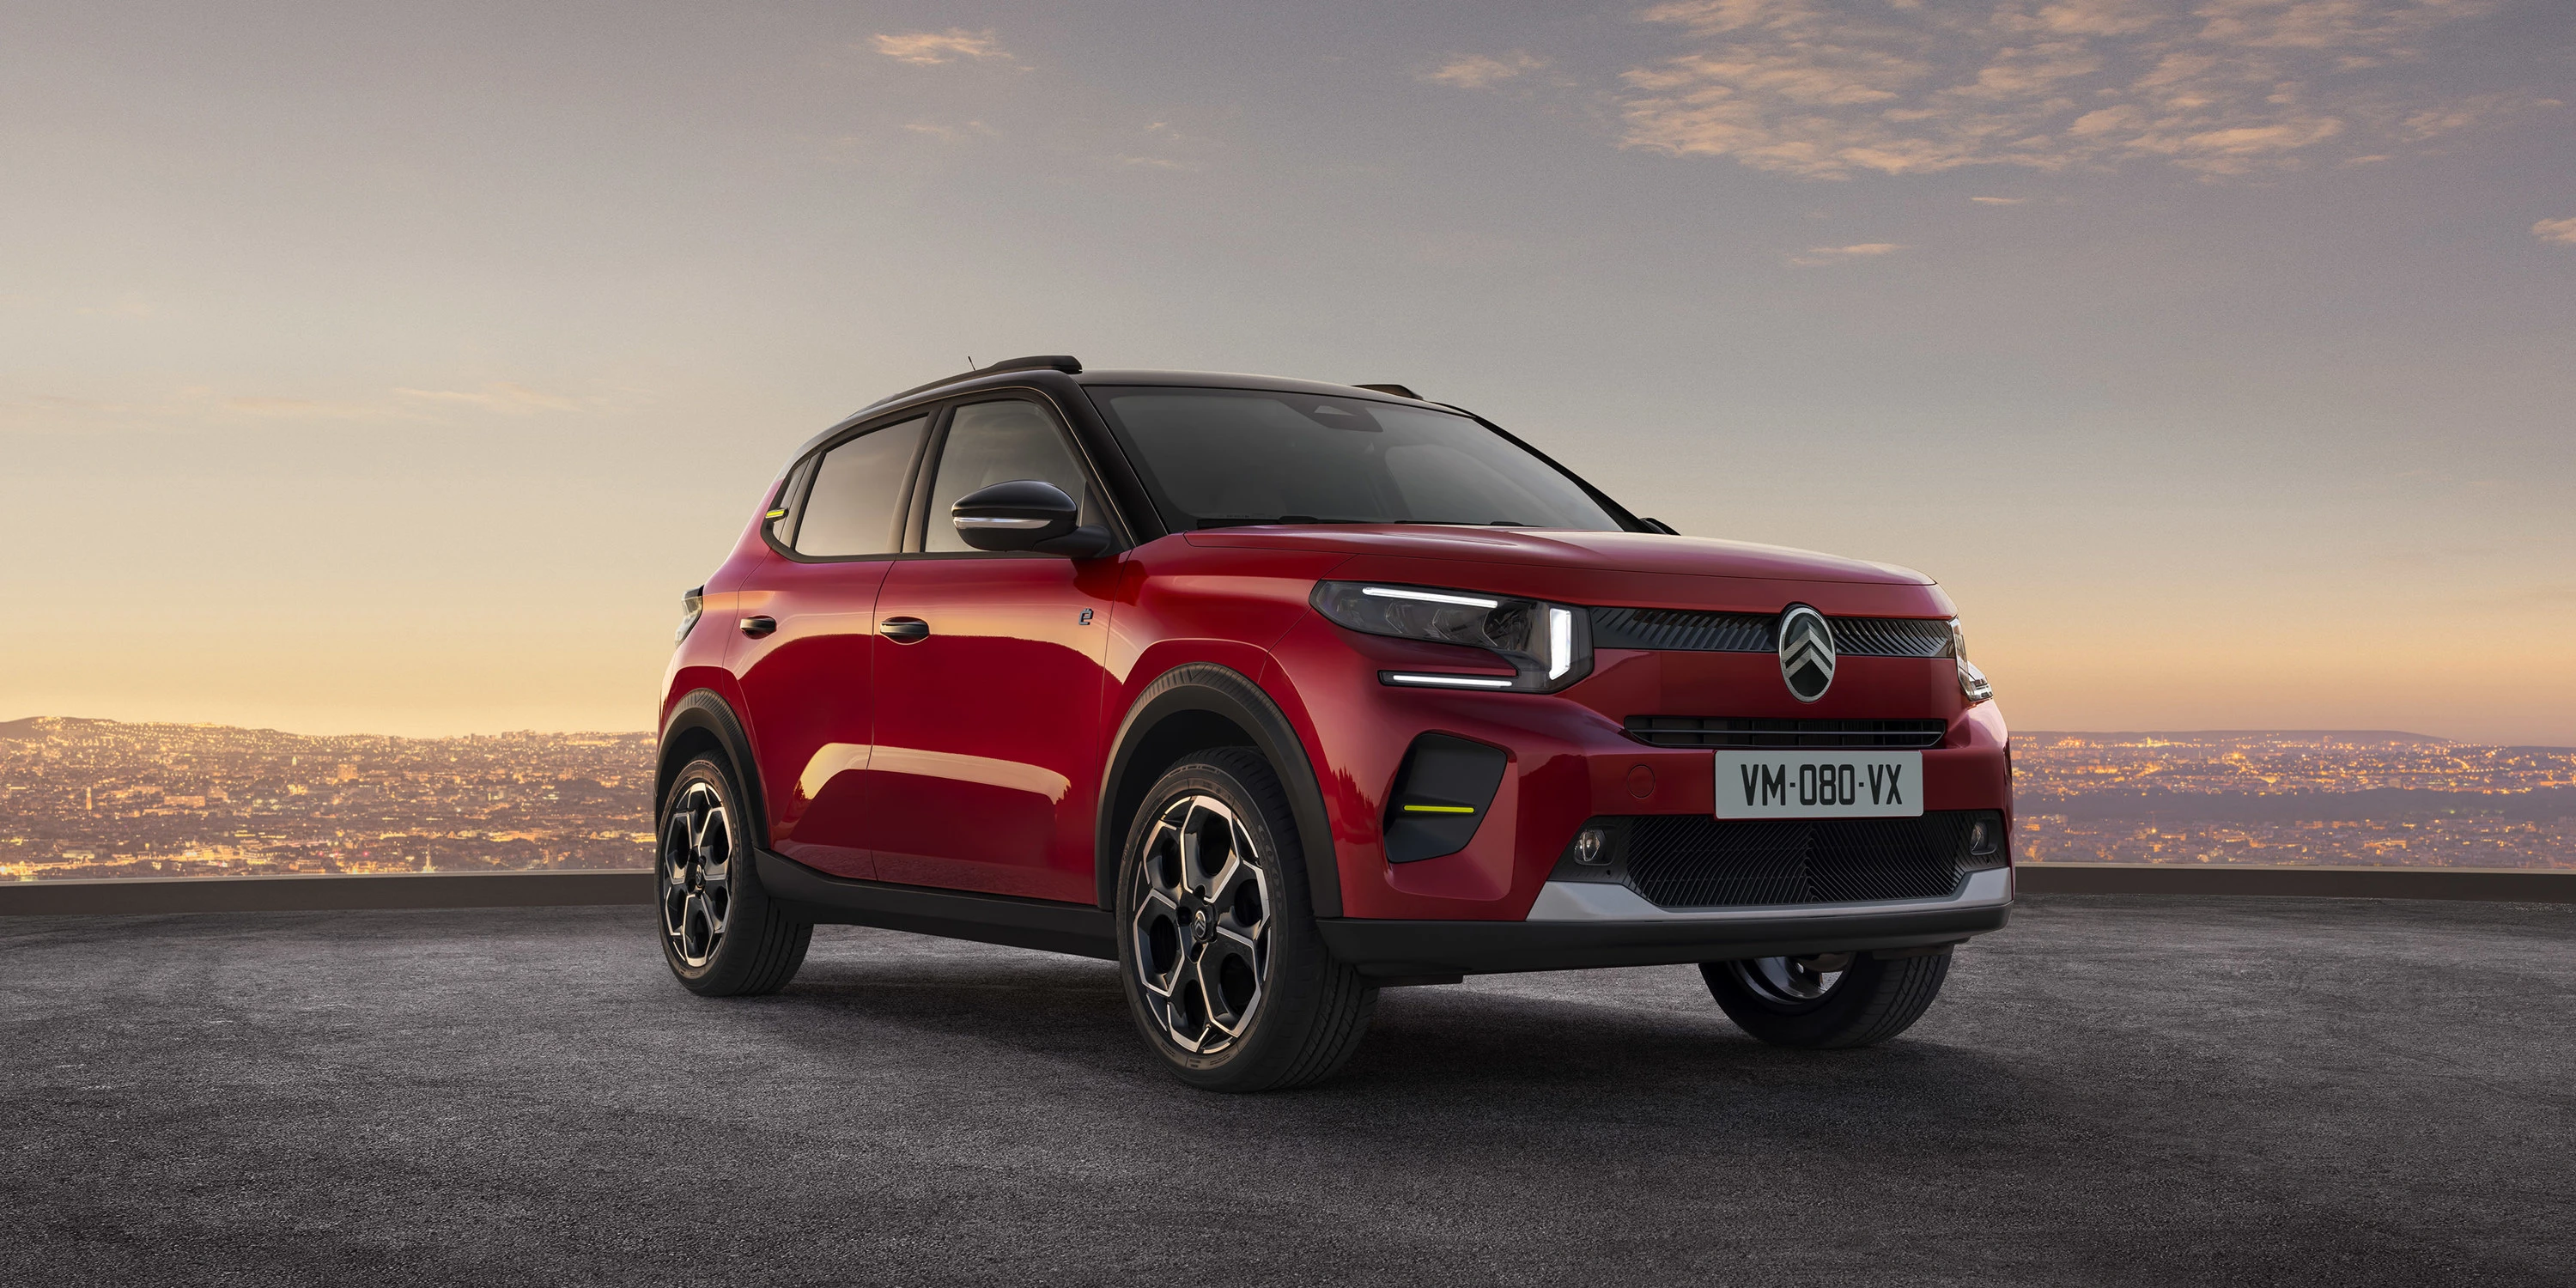
Citroën ë-C3 Urban Range

Citroën ë-C3
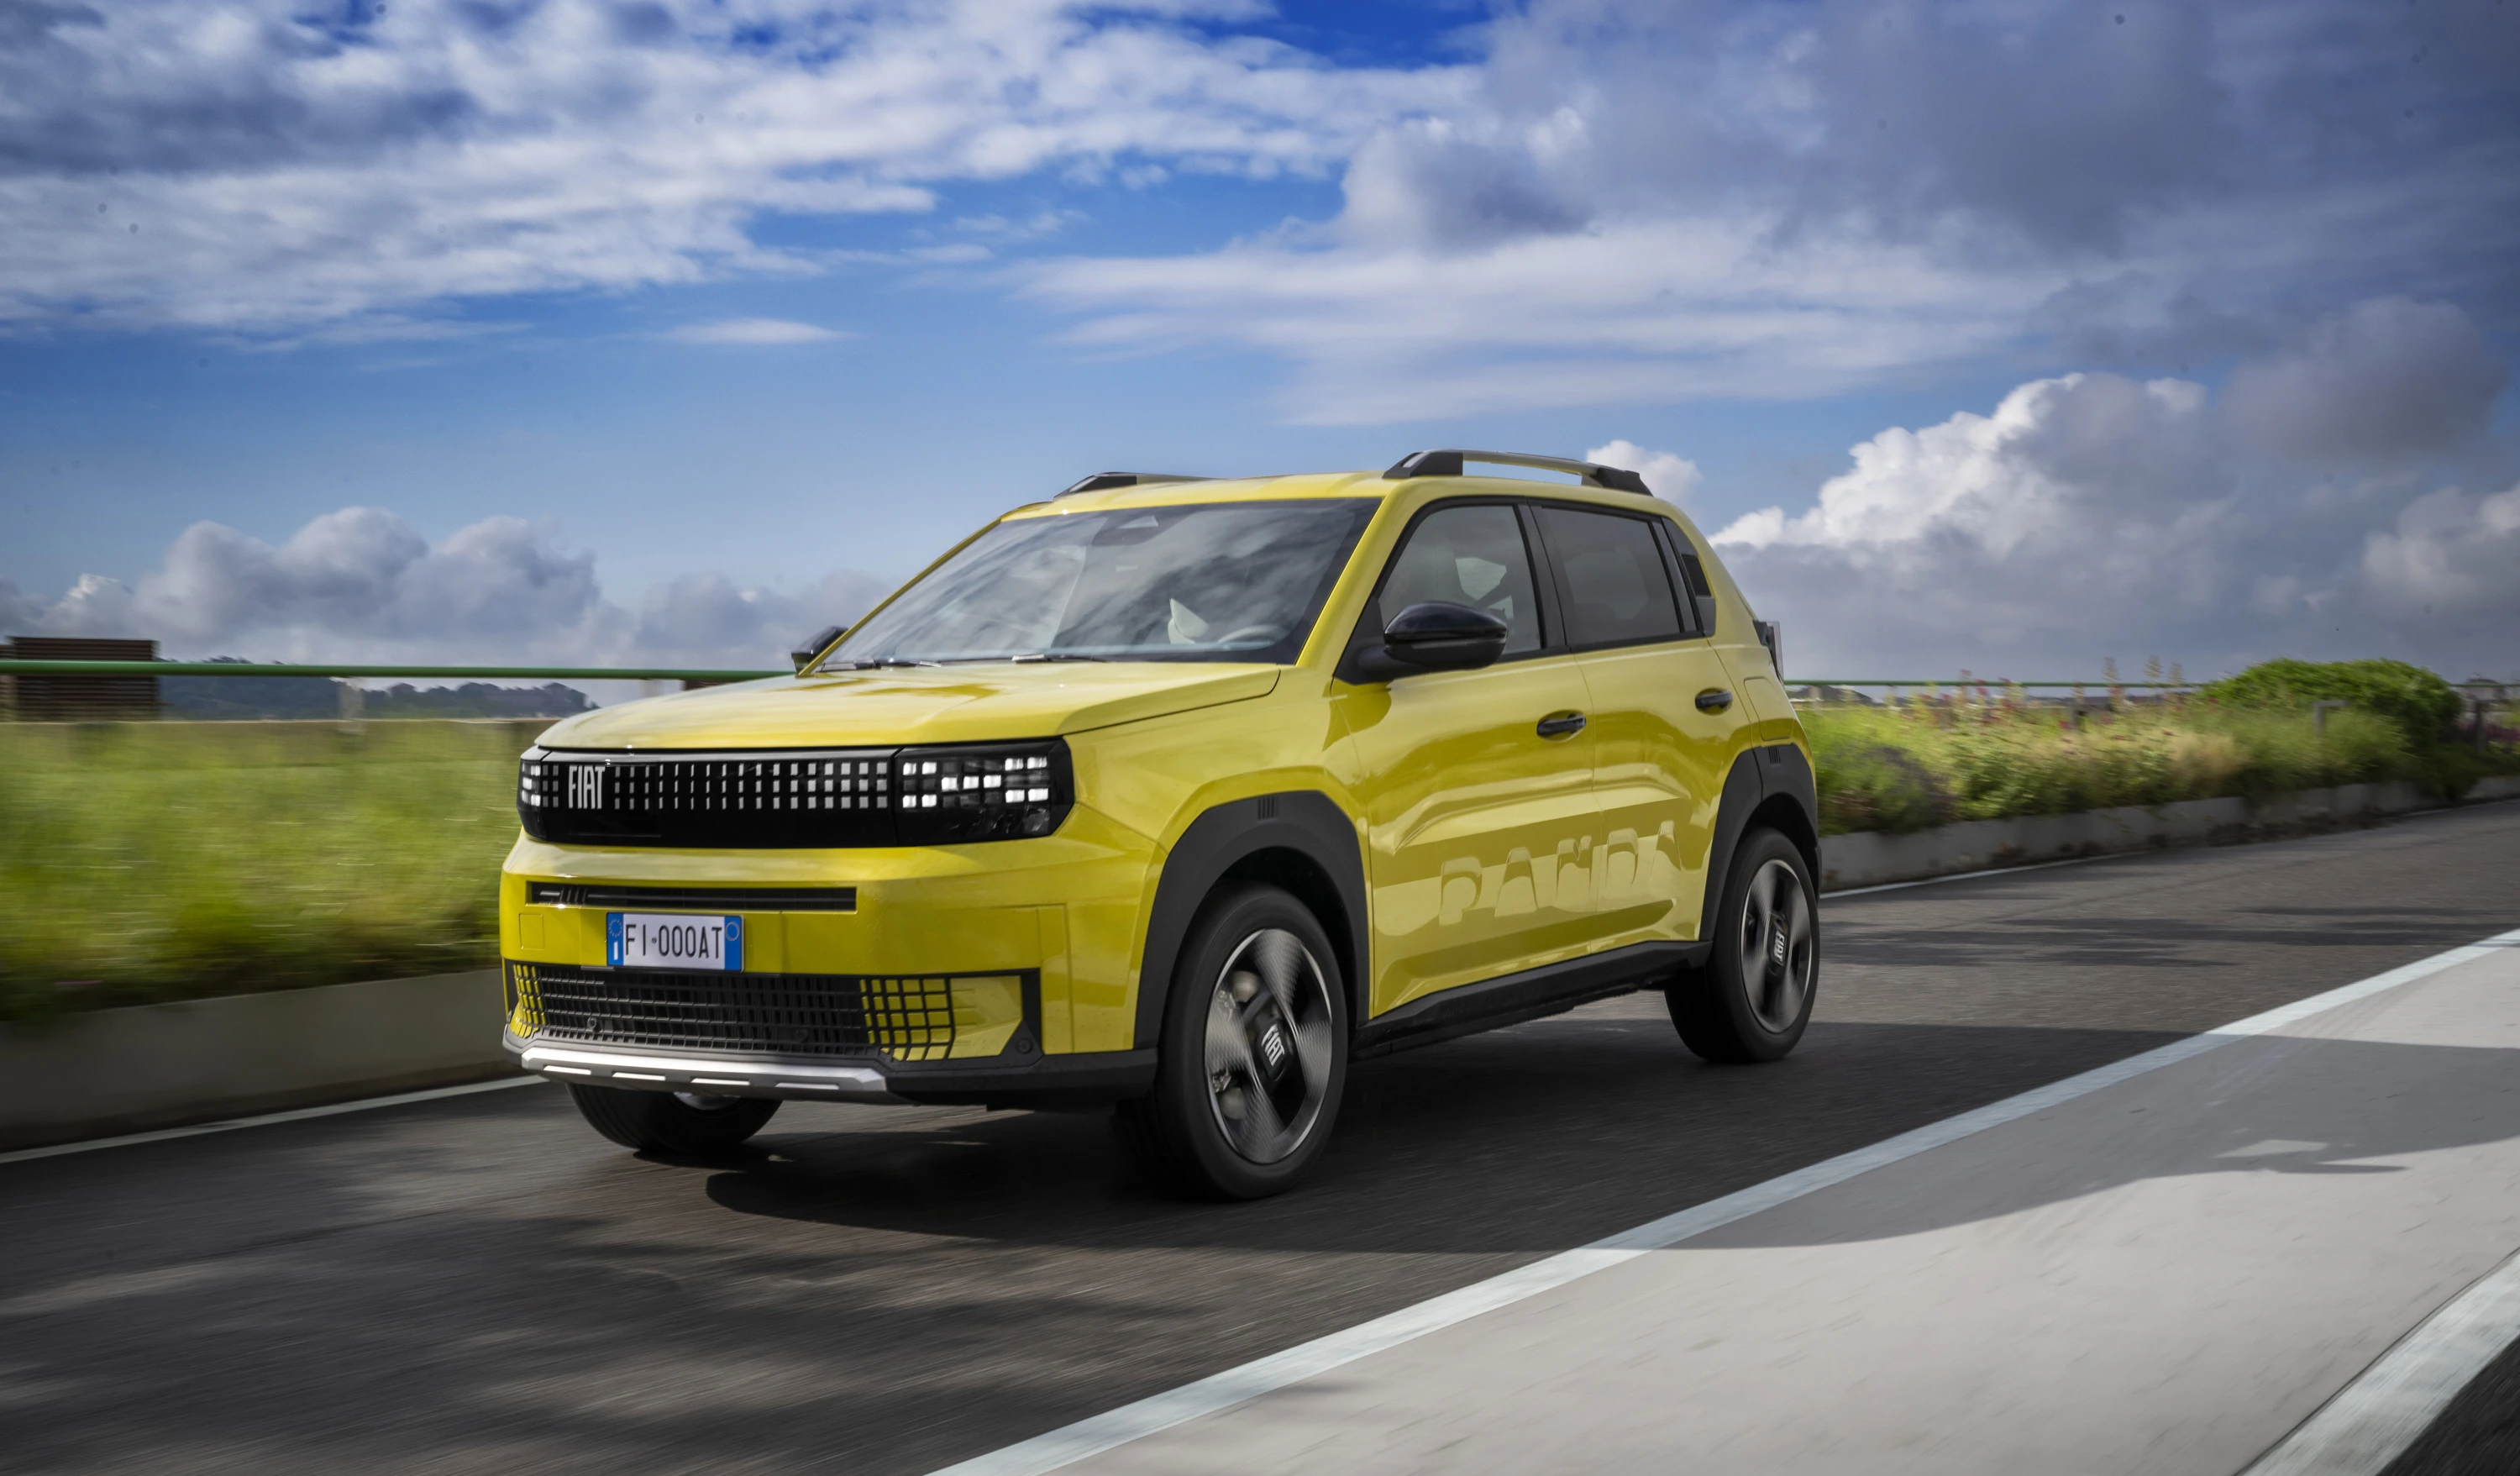
Fiat Grande Panda
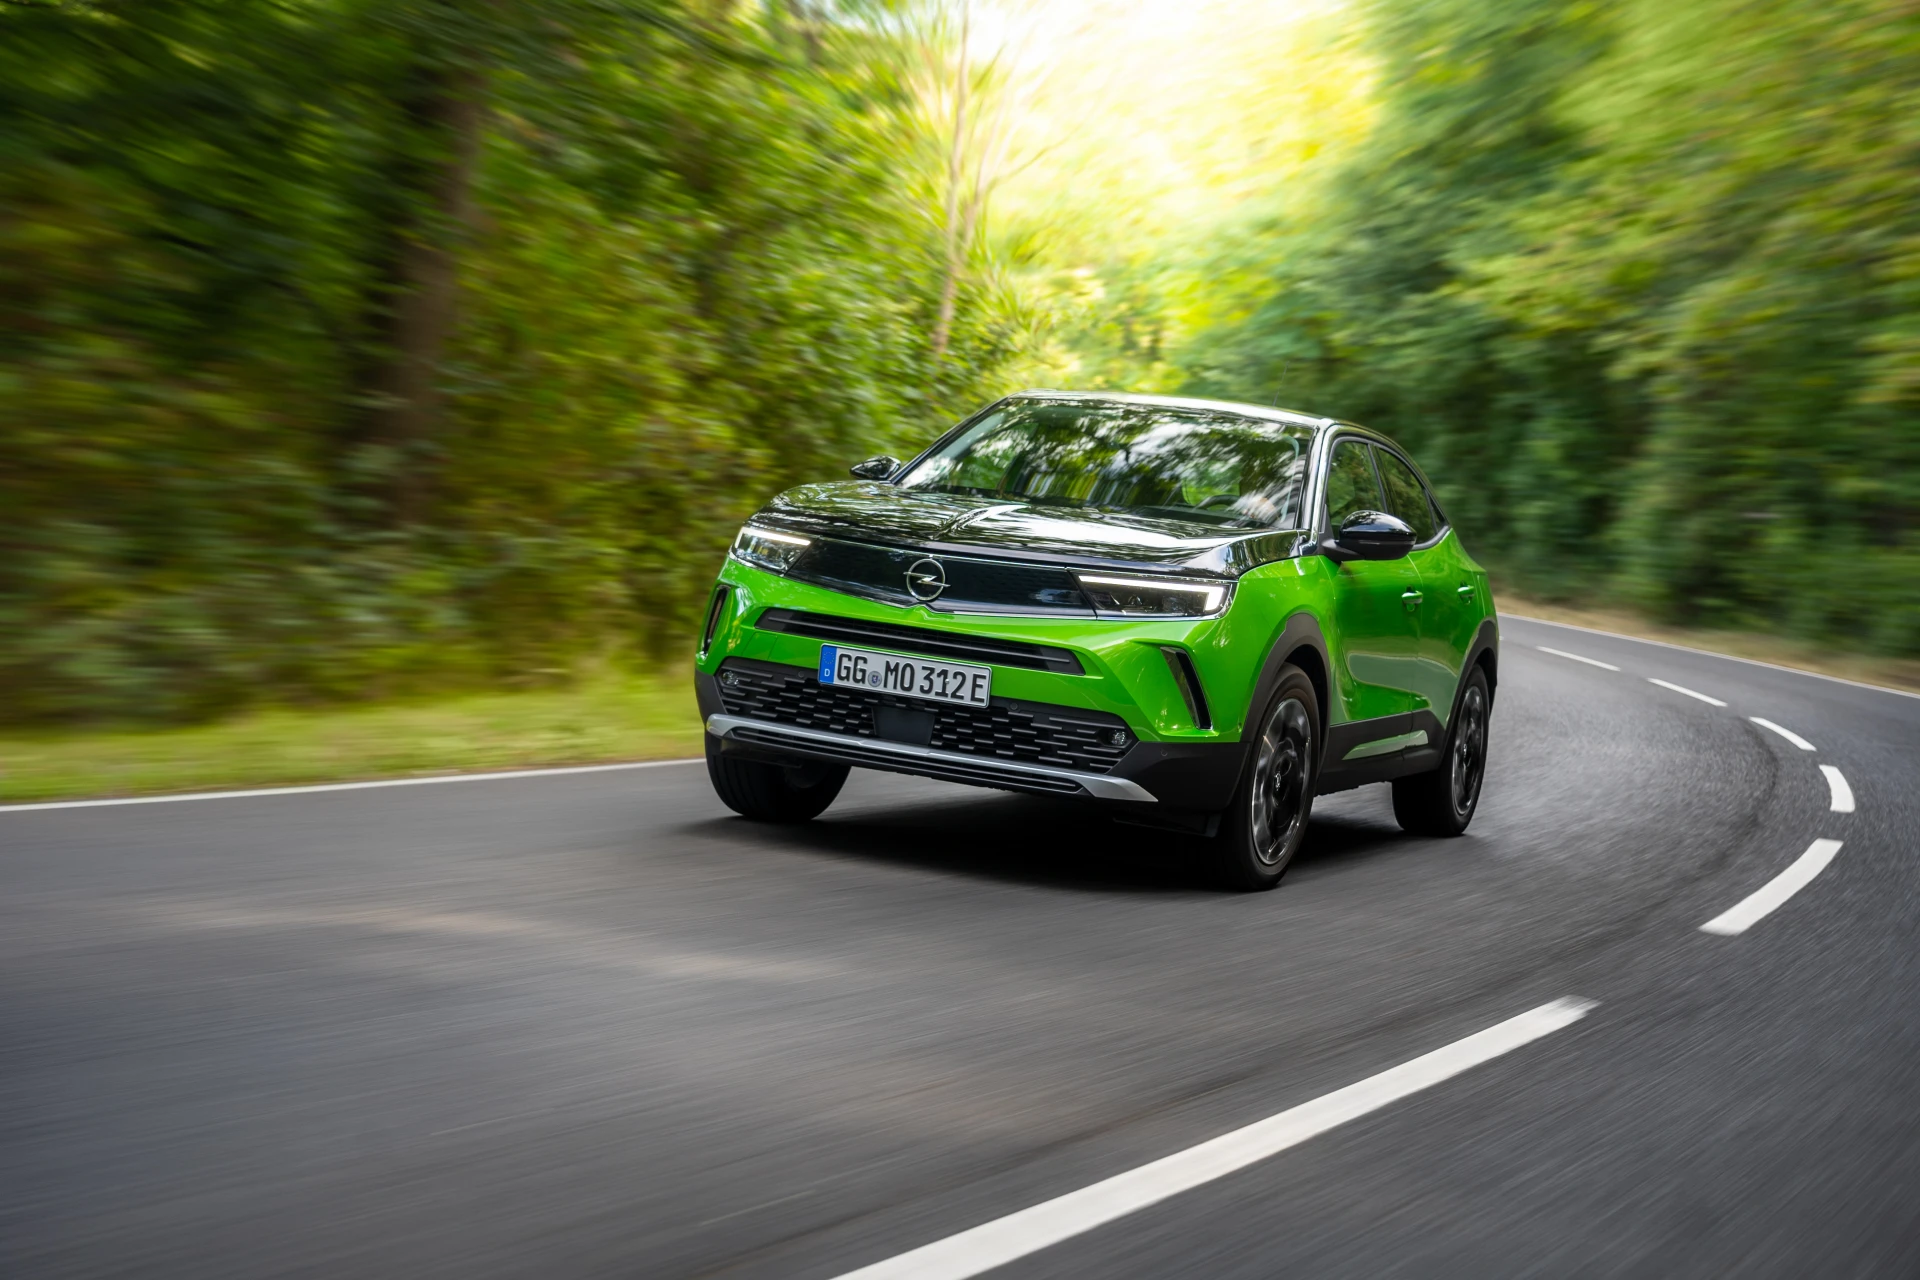
Opel Mokka Electric
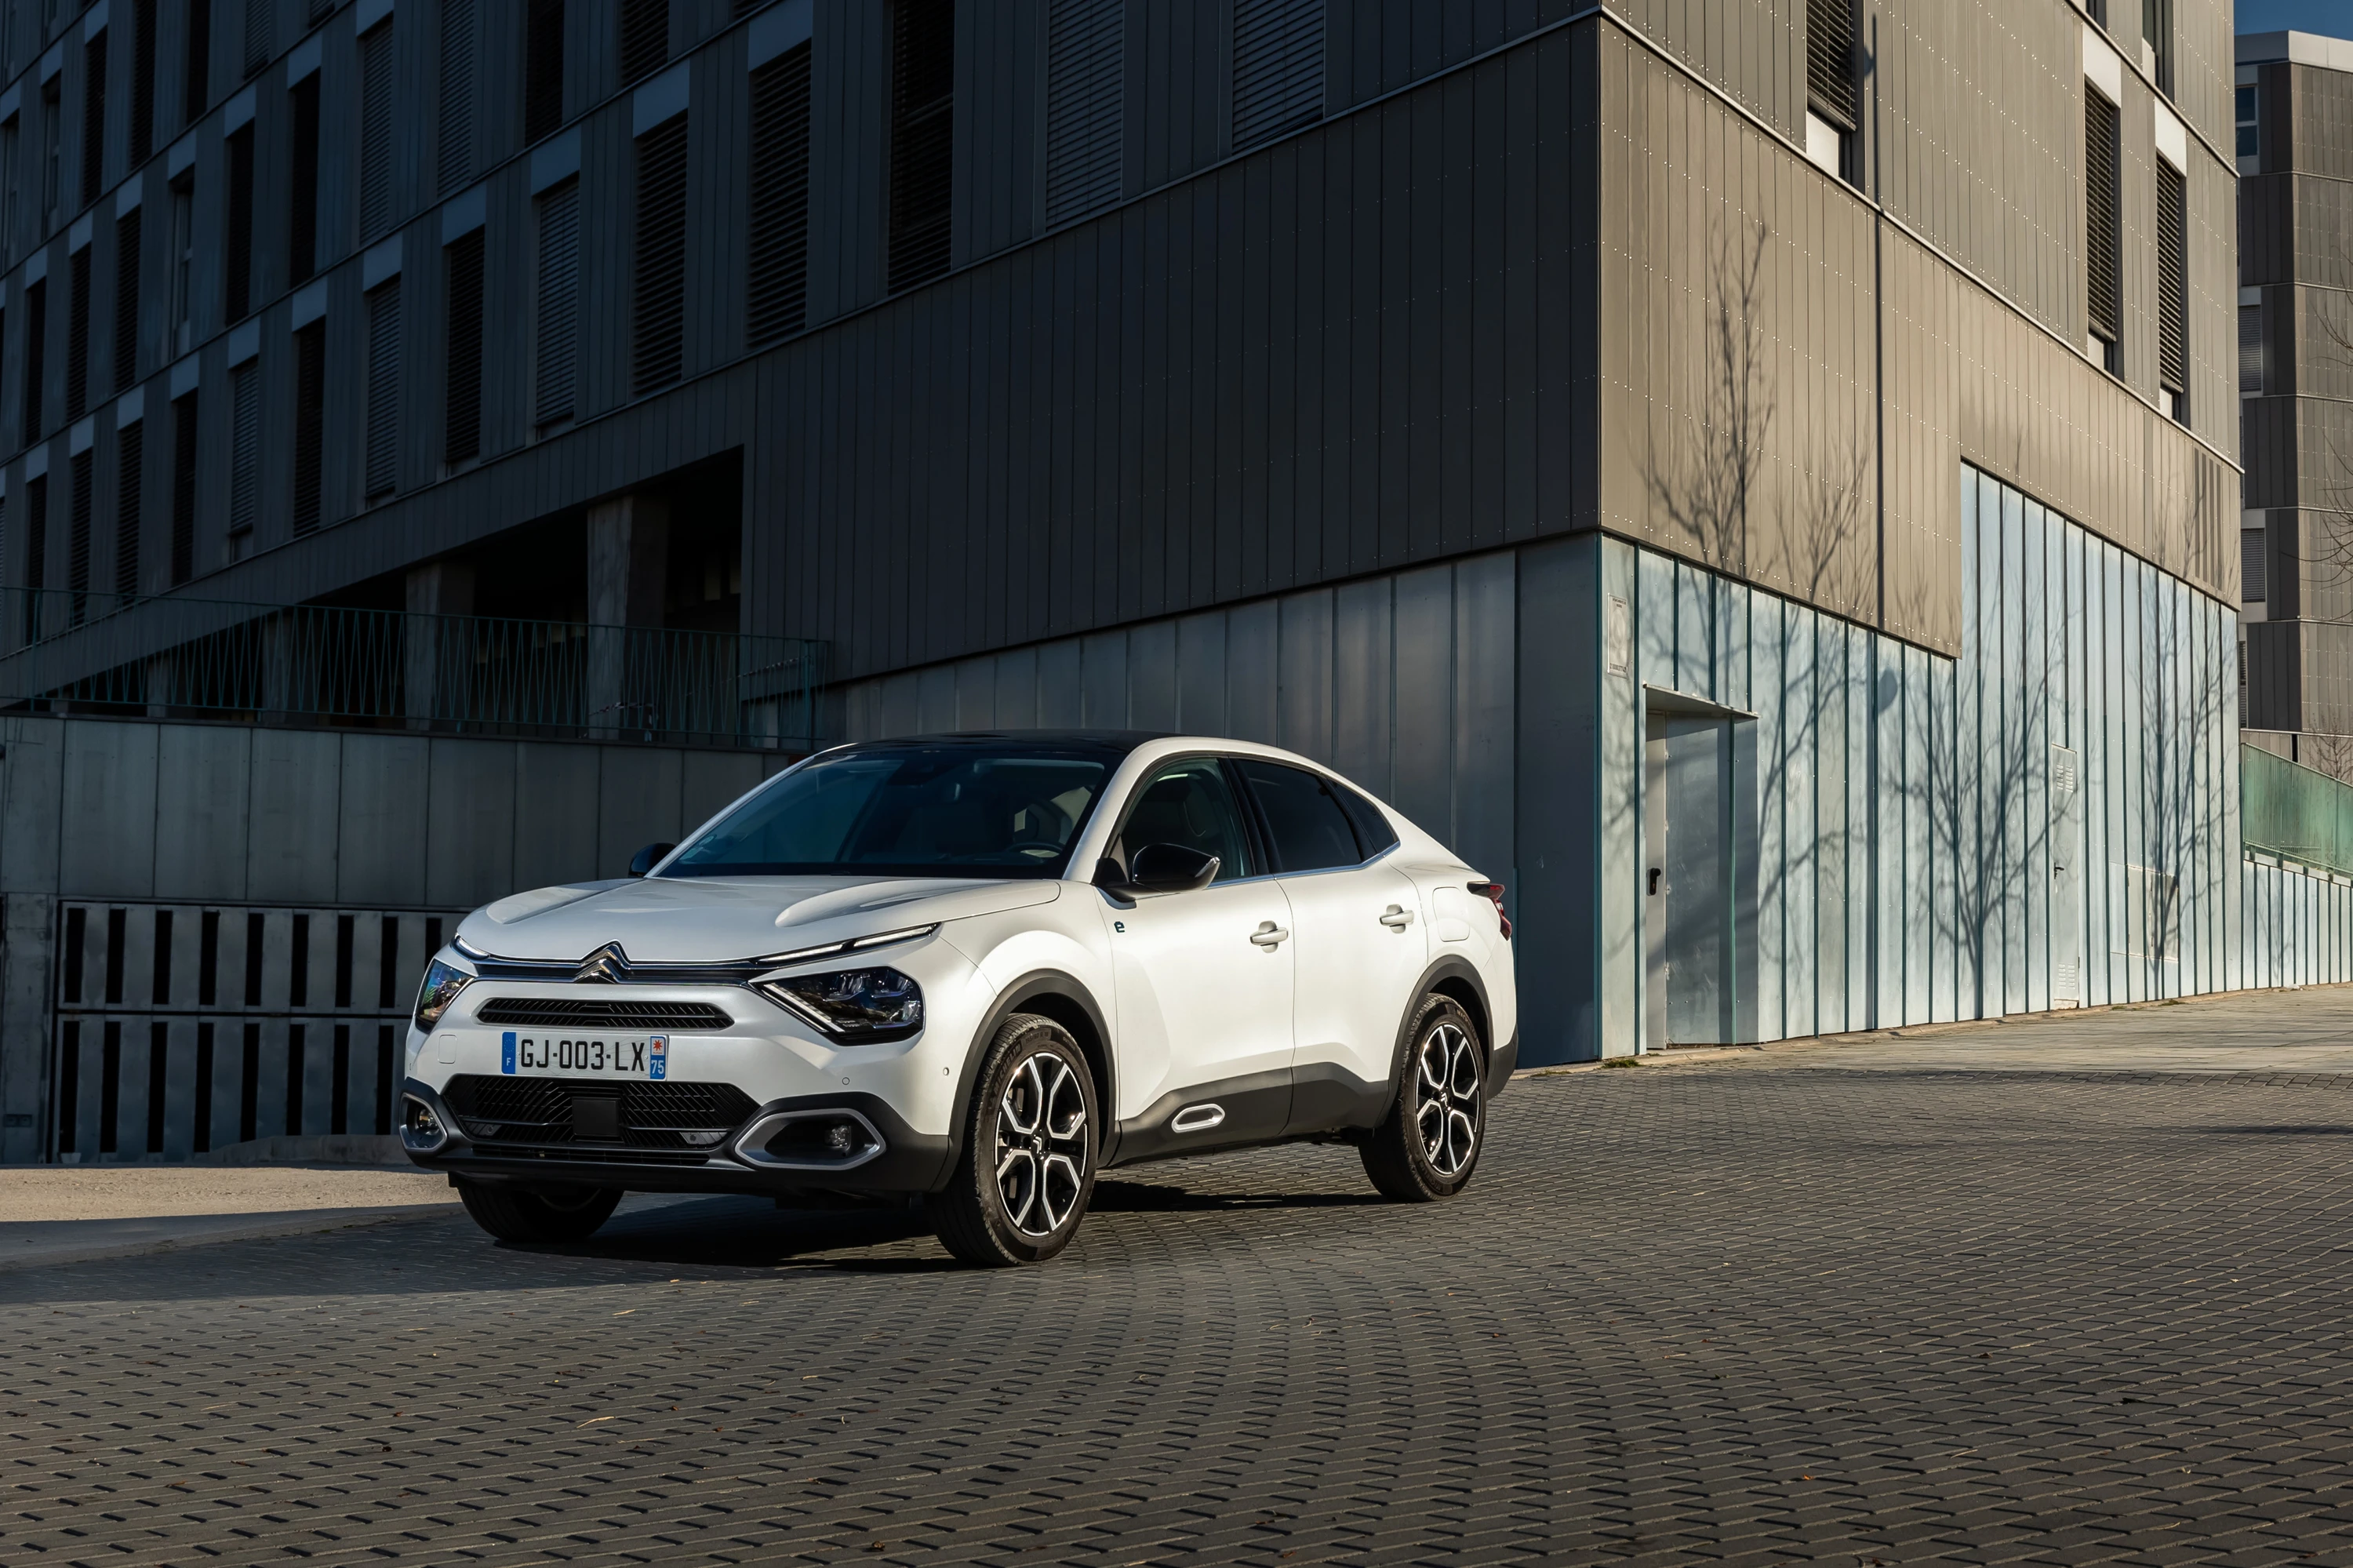
Citroën ë-C4 X

Jeep Avenger
Charging Curve & Charging Speed Analysis
Understanding Charging Performance
Charging performance isn't just about peak power—it's about sustained power across the entire charging curve. A vehicle that maintains 150kW from 10-80% SOC will charge faster than one that peaks at 250kW but quickly drops to 100kW after 20% SOC. The shape of the curve matters more than the highest peak power.
The key metric is C-rate, which accounts for both charging power and battery capacity. A C-rate of 2.0 means the battery can theoretically charge from 0-100% in 30 minutes, while 1.0 C-rate equals 60 minutes. This makes it easy to compare vehicles regardless of battery size.
Charging Curve Shape
Flat, sustained power across a wide SOC range beats high peaks that quickly taper off. Look for vehicles that maintain high power from 10-80% SOC.
C‑Rate & Timing
C-rate normalizes charging speed across different battery sizes. Higher C-rates mean shorter charging times and more flexible road trip planning.
Battery Options
Average Charging Power
57 kW
Avg C‑rate: 1.2
Maximum Charging Power
100 kW
At 9 → 19% SOC
Minimum Charging Power
10 kW
0–100% Charging Time
54 min
Charging Curve
State of Charge over Time
| SOC Range | Charging Time | Avg. Power | Avg. C-Rate | Energy Added |
|---|---|---|---|---|
| 0% → 100% | 54 min | 57.2 kW | 1.18 C | 52.0 kWh |
| 0% → 90% | 38 min | 72.1 kW | 1.49 C | 46.8 kWh |
| 0% → 80% | 32 min | 77.5 kW | 1.60 C | 41.6 kWh |
| 5% → 100% | 52 min | 57.0 kW | 1.18 C | 49.4 kWh |
| 5% → 90% | 36 min | 72.8 kW | 1.50 C | 44.3 kWh |
| 5% → 80% | 29 min | 78.8 kW | 1.63 C | 39.0 kWh |
| 10% → 100% | 50 min | 55.9 kW | 1.16 C | 46.8 kWh |
| 10% → 90% | 34 min | 72.1 kW | 1.49 C | 41.6 kWh |
| 10% → 80% | 27 min | 78.3 kW | 1.62 C | 36.4 kWh |